| Spectral Library and Data processing | damlaaygun09 | 2024-02-12 04:46 | |||||||||||||||||||||||||||||||||||||||||||
Hi, I'm trying to use Skyline version 23.1.0.380 for my thermo.raw proteomics datas. I have 2 diseased and 1 healthy data, and each one has 3 fragmentation. I want to get group comparision result LFQ and also need shared and different proteins between subjects. I watched tutorials from YouTube (MQSS 2023 - Dmitry Alexeev). I solved many problem but some points are still unknown for spectral peptide library. I have downloaded from Peptide Atlas and NIST but software is not accept these file types. I'm not sure about am I wrong when I download the library? The other problem is when I can get result for group comparision I see the adjust p-value as 1.00 so I don't know what is the actually correct steps for my aim. Can you help me?Thank you! Damla |
|||||||||||||||||||||||||||||||||||||||||||||
| |||||||||||||||||||||||||||||||||||||||||||||
 screen of p-value.JPG
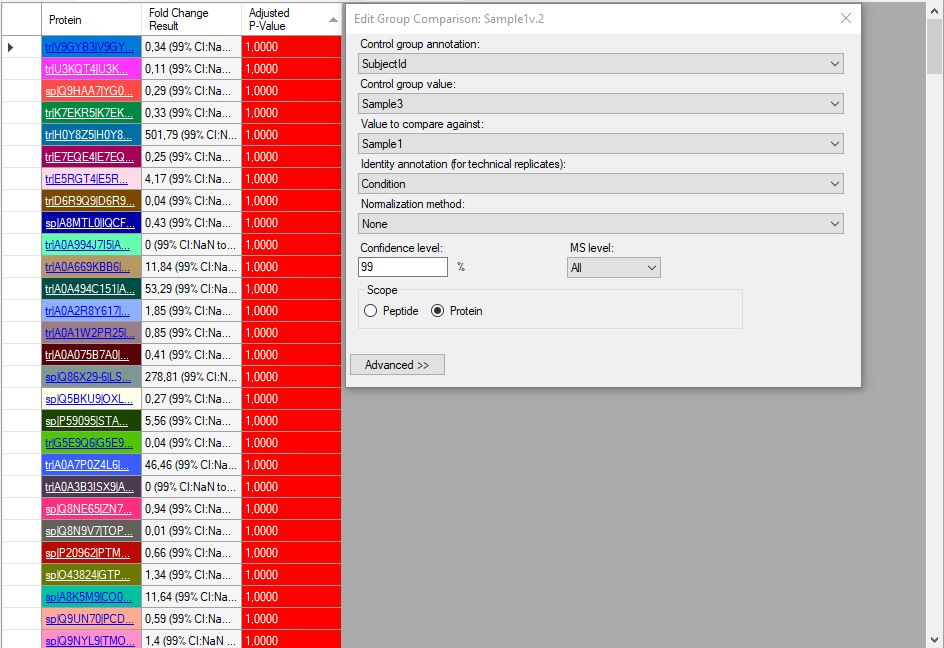 screen1.JPG
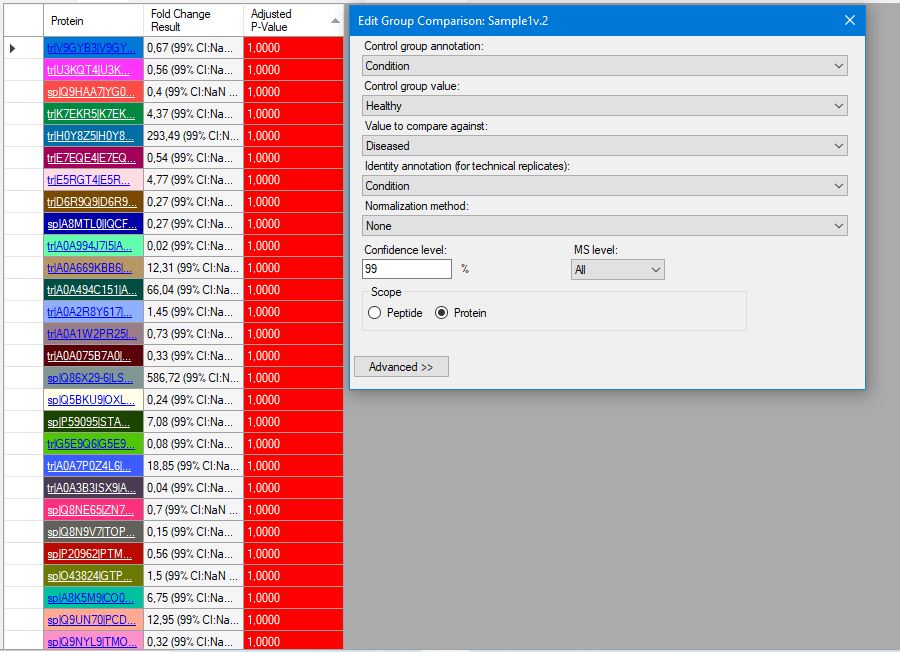 screen2.JPG
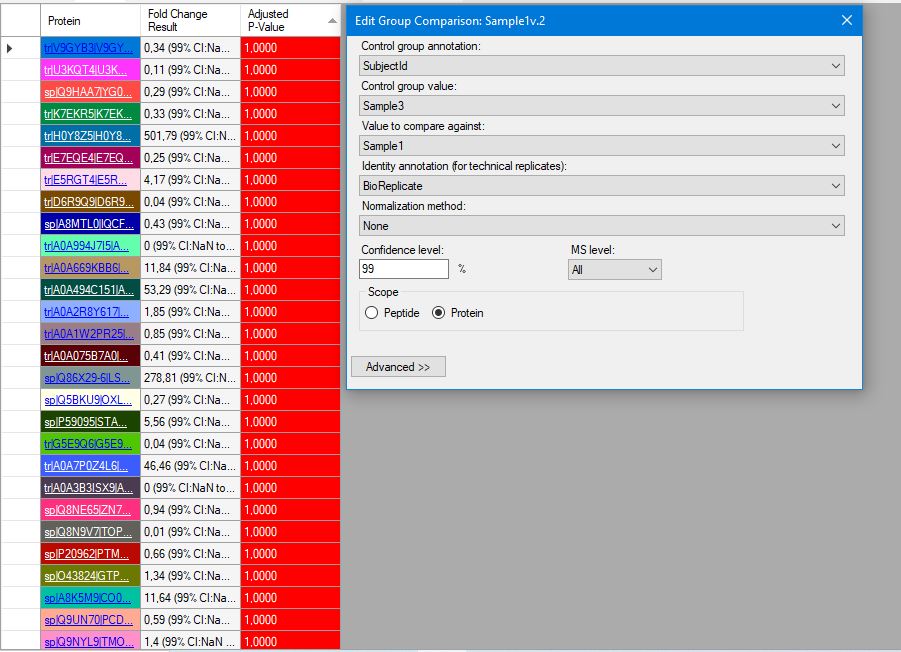 screen3.JPG