Can you send us your Skyline document and your raw file?
In Skyline you can use the menu item:
File > Share
to create a .zip file containing your Skyline document and supporting files including extracted chromatograms. The "Share Skyline Document" also gives you the opportunity to include your .raw file(s) in the .zip file that you create, or you can send us the .raw file separately whichever is easier.
Files which are less than 50MB can be attached to this support request. You .zip file and/or the .raw file will probably be bigger than that so you should upload them here:
https://skyline.ms/files.url
When you first bring up the Full Scan graph by clicking on a chromatogram, Skyline shows you the m/z channels that were summed across to produce the extracted ion chromatogram. That is, for each Transition in the Targets tree, Skyline shades a portion of the graph showing you what part of the spectrum Skyline looked at to produce that transition's chromatogram. The width of the channel that Skyline highlights is controlled by the "Resolution" or "Mass Accuracy" setting at "Settings > Transition Settings > Full Scan".
When you choose "Show Peak Annotations", Skyline displays a label on top each peak in the spectrum that Skyline was able to identify as a particular potential fragment from your precursor, regardless of whether that transition actually appears in your Targets tree. In this peak annotation mode, the types of transitions that Skyline looks for is controlled by what has been chosen with the "Ion Types", "Special Ions", "Precursor" and "Charges" items on the right-click menu.
In order for Skyline to display the label on top of a peak in the spectrum, the observed m/z in the spectrum has to be sufficiently close to the calculated m/z of the fragment ion. The setting which controls how close those two numbers have to be is the "Ion match tolerance" setting at "Settings > Transition Settings > Library".
-- Nick
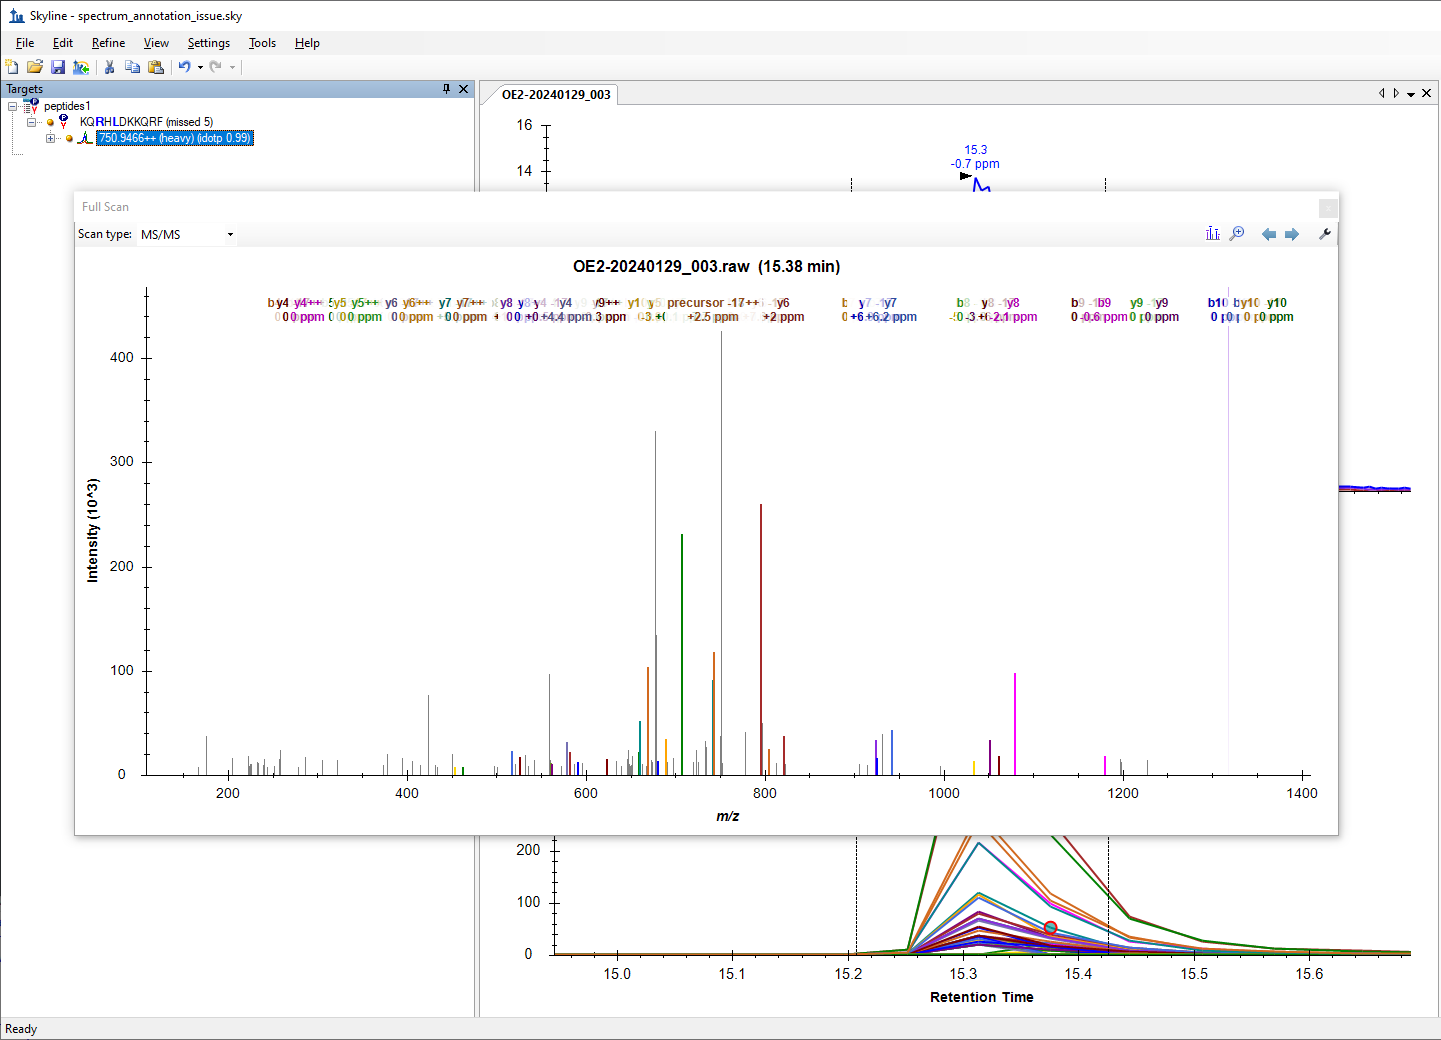 spectrum_annotation_issue_control.png
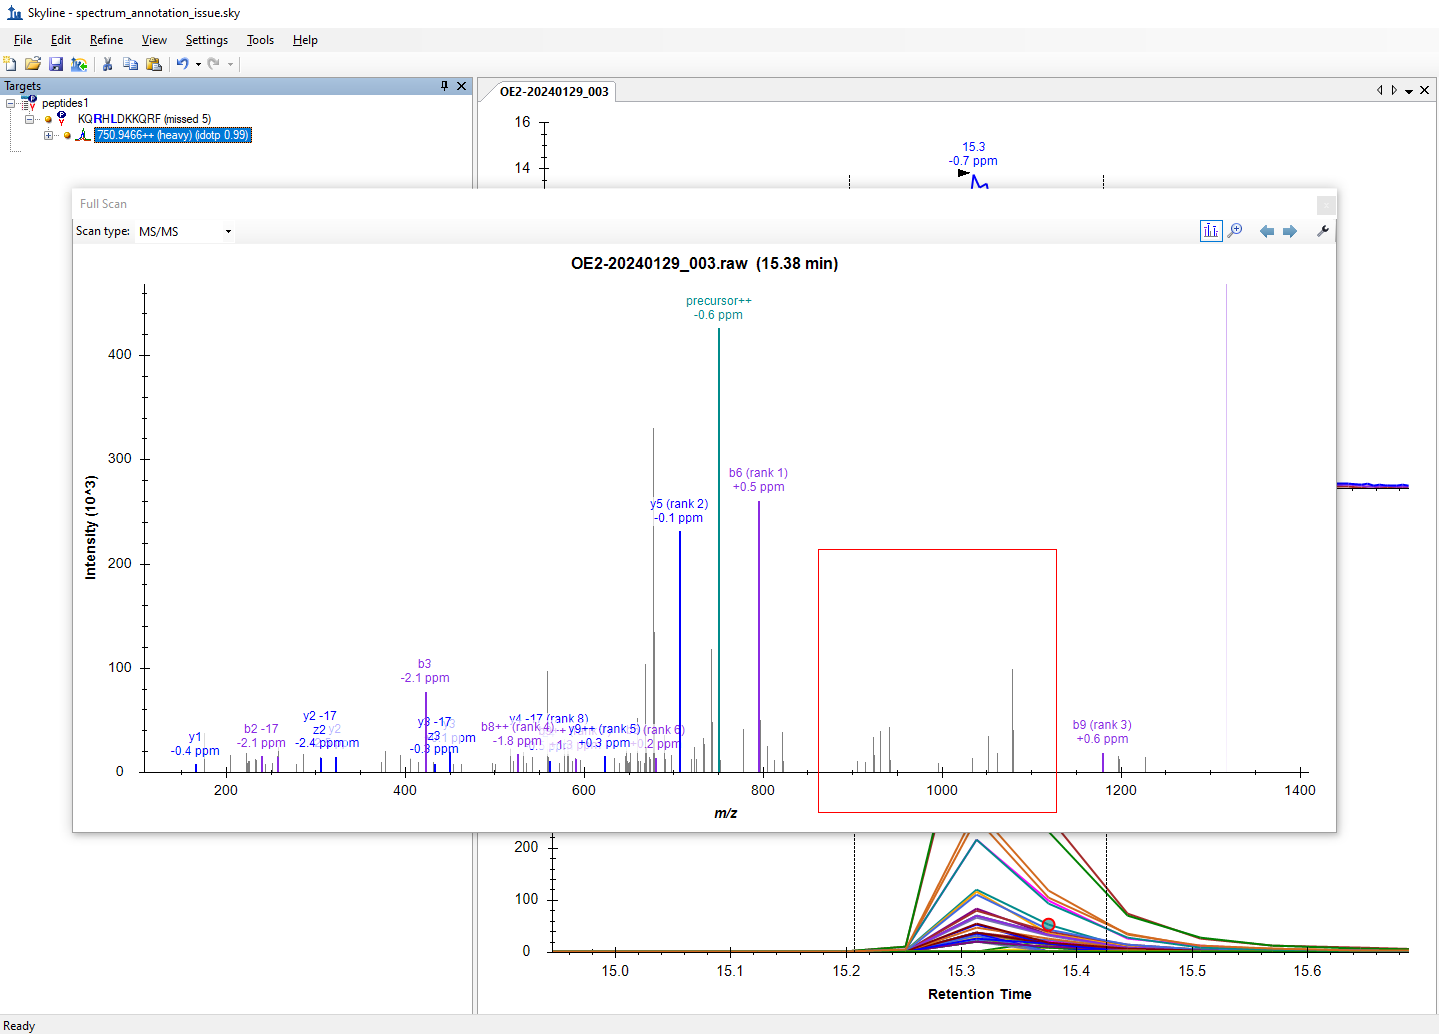 spectrum_annotation_issue.png