| |
| Nick Shulman responded: |
2024-02-29 13:57 |
If you send us your Skyline document and your .raw file we could probably tell you what is going wrong.
In Skyline you can use the menu item:
File > Share
to create a .zip file containing your Skyline document and supporting files including whatever chromatograms have been extracted.
There is also an option in the Share Skyline Document dialog to include the .raw files, or you could send those to use separately.
Files which are less than 50MB can be attached to this support request. You can upload larger files here:
https://skyline.ms/files.url
It sounds like you intended to attach a PowerPoint to this support request but no file was actually attached. Sometimes that happens if the file you were trying to attach was bigger than 50MB, in which case you could upload it to https://skyline.ms/files.url along with your Skyline document and raw file.
-- Nick |
| |
| ekilic responded: |
2024-02-29 14:21 |
Dear Nick,
Thanks for your prompt reply! I have just uploaded files including the Skyline document, zipped raw file and the PowerPoint file containing the method summary.
Best,
Ece |
| |
| Nick Shulman responded: |
2024-02-29 14:33 |
Thank you for uploading those files.
What are you seeing in Skyline and how is that different from what you are expecting to see?
Is there a particular molecule whose chromatogram appears to be incorrect?
By the way, usually if you have questions about why a particular point along the chromatogram has the value that it does, you can click on that point and Skyline will bring up a spectrum viewer which will show the spectrum that contributed to that point with the m/z of your transitions highlighted showing the m/z window that Skyline summed across to obtain the intensity at that point.
Unfortunately, Skyline seems to have a bug in it and when Skyline tries to show you a spectrum Skyline says "Object reference not set to an instance of an object." This bug has something to do with displaying information about the instrument serial number on the property sheet, and, unfortunately, it makes the Full Scan viewer unusable for your dataset.
I will try to fix this bug as soon as possible because the spectrum viewer is a very powerful tool for figuring out why your chromatograms do not look the way they are supposed to.
-- Nick |
| |
| ekilic responded: |
2024-02-29 15:34 |
Hi Nick,
I have a list of compounds that haven't been extracted in Skyline, including arginine, whose m/z falls in the 2nd spectra. If you have Quan Browser, extracting EIC for arginine shows a detection, while Skyline indicates no detection. We suspect Skyline may be unable to merge two scans into one, resulting in a gap for compounds like arginine falling within the m/z ranges of the second spectra. I can send you the list tomorrow. |
| |
| ekilic responded: |
2024-02-29 15:37 |
Regarding the "Object reference not set to an instance of an object" issue, we've observed it occurring recently. Thank you for your assistance in addressing it as well! |
| |
| Nick Shulman responded: |
2024-02-29 16:58 |
I think Skyline is getting confused by the multiple scan ranges of your SIM spectra.
For each MS1 spectrum, Skyline decides whether it's an ordinary MS1 spectrum or a SIM spectrum. The way that it decides this is by seeing whether the scan range of the spectrum is more or less than 500 m/z units.
If the scan range is more than 500 units then Skyline thinks it is a regular MS1 spectrum, and a point gets added to every precursor's MS1 chromatogram.
If the scan range is less than 500 units then only precursors whose m/z is within that scan window get a chromatogram added to their SIM chromatogram.
When Skyline shows you a chromatogram, it will show you the SIM chromatogram if it exists, otherwise the MS1 chromatogram.
The thing Skyline is doing wrong which is messing up with your data is that when Skyline is deciding whether a spectrum is SIM or MS1, if there are multiple scan windows, Skyline only looks at the width of the first scan window.
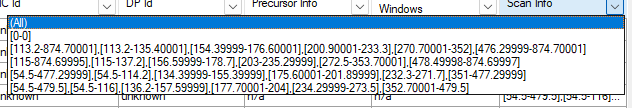
When I look at your raw file in ProteoWizard SeeMS.exe, the scan ranges of your SIM spectra do not make much sense.
The first scan window is really wide such as "[113.2-874.7]" or "[54.5-477.3]".
The thing is "113.2-874.7" is wider than 500, so those spectra end up going into the MS1 chromatogram that does not get used if there's a SIM chromatogram.
The "54.5-477.3" is less than 500, so those go into the SIM chromatogram.
Arginine has m/z 175 so it's expected to be found in both of those spectra but you only end up seeing the SIM chromatogram.
Why do your SIM spectra have such a wide window in addition to the narrower windows such as "113.2-135.4" that would be more appropriate for a SIM spectrum? I am attaching a screenshot showing the scan ranges that I see in SeeMS.exe.
-- Nick |
|
| |
| ekilic responded: |
2024-03-01 14:56 |
Hi Nick,
Following your recommendation, we extended the scan ranges to >500 m/z for each scan, and I've uploaded the file for your reference.
This adjustment has effectively resolved the extraction issue we initially discussed. However, it has introduced a new challenge. Our data, consisting of multiplexed tSIMs (comprising 2 spectra, each with 5 boxes), is now being interpreted by Skyline as a single, continuous spectrum, including the gaps from both spectra, leading to a rugged peak appearance as illustrated in the attached file. This merging process unfortunately permits in only partial integration of the data. Upon comparing this data with that acquired through full-scan method, we noticed that, despite similar peak heights, the integrated area is significantly lower.
We've experimented with various transformation options in an attempt to smooth the data points belong to either spectra only, but so far, we haven't found a solution.
We look forward to hearing your suggestions on how we can overcome this new hurdle.
Thank you! |
|
| |
| Nick Shulman responded: |
2024-03-01 15:06 |
When you have a jagged chromatogram like in your left screenshot, you can use the relatively new "Spectrum Filter" feature to fix this.
This feature gives you a lot of control over exactly which spectra will be used for the extracted ion chromatogram.
There are some screenshots showing how to use this new feature here:
https://skyline.ms/wiki/home/software/Skyline/page.view?name=SpectrumFilters
This feature was added in Skyline 23.1, and we have not received very much feedback about whether it's actually useful.
-- Nick |
| |
| Nick Shulman responded: |
2024-03-01 15:12 |
By the way, why would you widen the scan window? Wouldn't that completely defeat the purpose of pre-filtering the ions before they enter the trap?
-- Nick |
| |
| ekilic responded: |
2024-03-01 15:42 |
Hi Nick,
Thanks for your prompt reply as always!
I followed the instructions in the link you provided to apply the "Spectrum Filter." However, upon re-importing the files, there is an issue as it does not display any chromatogram. I have attached a screenshot for your reference. In the image, you can observe the spectrum filter information next to the selected precursor ion.
Ece |
|
| |
| ekilic responded: |
2024-03-01 15:44 |
Re to scan window: This was a preliminary testing to verify its functionality. Further optimization of the scan ranges would be necessary. |
| |
| Nick Shulman responded: |
2024-03-01 16:48 |
The simplest way for you to fix this would be to get rid of the really wide SIM scan window.
You have some spectra which have the following scan six scan windows:
113.2-874.7, 113.2-135.4, 154.4-176.6, 200.9-233.3, 270.7-352.2, 564-874.7
If it weren't for that "113.2-874.7" at the beginning then Skyline would look at each of those scan windows, and a spectrum would only contribute to a precursor's XIC if that precursor were in one of the five other reasonably-sized scan windows.
Your other spectra look have the following six scan windows:
54.5-565.0, 54.5-116, 136.2-157.6, 177.7-204, 234.3-273.5, 352.7-565
Similarly, if it weren't for that "54.5-565", Skyline would do the correct thing with these spectra too.
The "Spectrum Filter" unfortunately does not give you any hints about what property you could filter on to distinguish these two sorts of spectra, but one that would work is the one called "Scan Window Width".
The Scan Window Width is the difference between the lowest lower bound of all of the scan windows and the highest upper bound of all the scan windows. So, for that 113.2-874.7 set of scan windows, that difference is 761.5. For the 54.5-565.0, that difference is 520.5.
For this reason, you could make a spectrum filter "Scan Window Width is less than 600" and that would get you one set of spectra.
But, the easier thing would be to figure out why, in addition to the relatively narrow scan windows, your spectra also seem to have that big wide window that makes no sense.
-- Nick |
| |
| ekilic responded: |
2024-04-04 11:05 |
Hi Nick,
It has been a while since our recent conversation.
Regarding the six-scan range you mentioned, the first range you see actually represents the ultimate lower and upper bounds of the mass ranges. We will attempt to convert the raw file to mzML and mzXML formats and then identify the first range to remove it from the text. We hope this approach will prove helpful.
Additionally, we wanted to seek your assistance regarding your suggestion about Spectrum Filter. Currently, we are only able to visualize the rugged spectrum in the title, including the transition for both negative and positive modes, but not the individual precursor. To clarify, I have attached a screenshot for your reference in the accompanying PowerPoint document. We believe that reflecting the rugged structure on the precursor could be beneficial for us to test Spectrum Filter as you suggested. Could you please guide us on how we could achieve that?
Thanks a lot!
Ece |
|
| |
| Nick Shulman responded: |
2024-04-04 11:31 |
I think the reason that only one of your screenshots shows the jagged chromatogram is that the other screenshot is zoomed out too far to be able to see it.
In order to have the best chance of seeing the jagged chromatograms, you should right-click on the chromatogram and make sure all of the following menu items are checked:
Transitions > All
Transitions > Split Graph
Transform > None
Auto-zoom X-axis > Best Peak
-- Nick |
| |
| ekilic responded: |
2024-04-04 14:00 |
Hi Nick,
I have some good news to share! The Scan Window Width feature worked successfully to remove the first wide scan range, resulting in a peak shape similar to the one observed in the full scan.
Now, my next question pertains to applying "Spectrum Filter" to all of the compounds in my Skyline project. Currently, I am applying it one by one. Is there a method to apply it to all compounds simultaneously?
Thank you for your ongoing support and contributions to the advancement of this project.
Ece |
| |
| Nick Shulman responded: |
2024-04-04 14:16 |
Yes, you can have multiple things selected in the Targets tree when you choose "Edit Spectrum Filter".
If some of the selected items already have different filters on them when you bring up the Edit Spectrum Filter dialog, then the "Create copy" checkbox will be checked and disabled.
If everything that you had selected had the same filter (for instance, if nothing in the document had a filter) then you will be able to choose whether you're applying the Spectrum Filter to everything that is there (leave "Create copy" unchecked) or you are adding a new set of precursors to the document that have the new spectrum filter (check the "Create copy" checkbox).
-- Nick |
| |
|
|
 SIM_scan_ranges.png