Calibration Curve

support
Calibration Curve naimamuntu  2024-03-20 21:28
 

Hi,

I am currently in the process of developing an MRM assay for 4 peptides, each with four pairs of light/ heavy. I am still learning, and I went through the tutorial. I have used a multiple-point calibration approach. I utilize light peptides as internal standard and heavy peptides that are isotopically labeled. I am wondering whether the concentration of the heavy peptide spike-in within samples must match the concentration of the constant heavy peptide used for the calibration curve. Also, what are the factors influencing the choice of concentration for the heavy peptides?

Thank you so much.
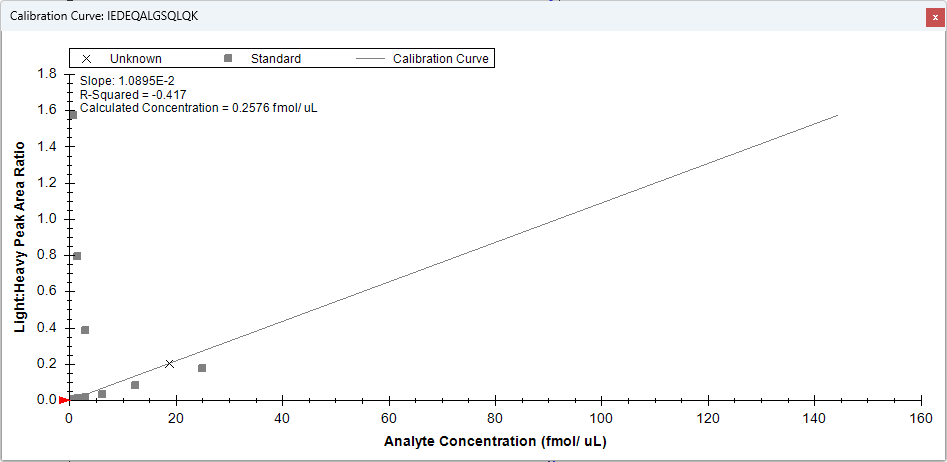
-Nitha


Nick Shulman responded:  2024-03-21 01:19
I do not understand your question but if you send us your Skyline document I might be able to figure it out.

In Skyline you can use the menu item:
File > Share
to create a .zip file containing your Skyline document and supporting files including extracted chromatograms.
If that .zip file is less than 50MB you can attach it to this support request. You can upload larger files here:
https://skyline.ms/files.url

In general, the purpose of a calibration curve is to figure out what concentrations of your analyte are within the linear range of your mass spectrometer. For this reason, some of your calibration points should have a concentration which is lower than what you expect to find in your unknown samples, and some points should have a higher concentration.
-- Nick
 
naimamuntu responded:  2024-03-27 19:43
Thanks, Nick.

The document is under "Nitha_Skyline supportMYH7_IEDEQALGSQLQK_32424_8PM."
I am using the calibration curve to determine the concentration of the light peptide (the area under the curve) in the samples. The retention time is between 24.79 (light) and heavy (24.80).
Could you provide tutorials on analyzing unknowns across multiple samples? I am investigating the differences between groups.

Thank you so much
-Nitha
 
Nick Shulman responded:  2024-03-27 20:22
If you want to compare abundances between groups of replicates you should look at the Group Comparison tutorial:
https://skyline.ms/wiki/home/software/Skyline/page.view?name=tutorial_grouped

Usually, a group comparison would not involve a calibration curve at all. You are comparing quantities between two groups of replicates and you do not need to know the absolute quantity that you might be able to get from a calibration curve.

The chromatograms in your Skyline document look very good.
Six of the points on your calibration curve look really good and are on a straight line, but there are three other points that are nowhere near that line. I am not sure what is wrong with those three points but you can right-click on them and choose "Exclude from calibration" and your calibration curve will look like the attached picture "
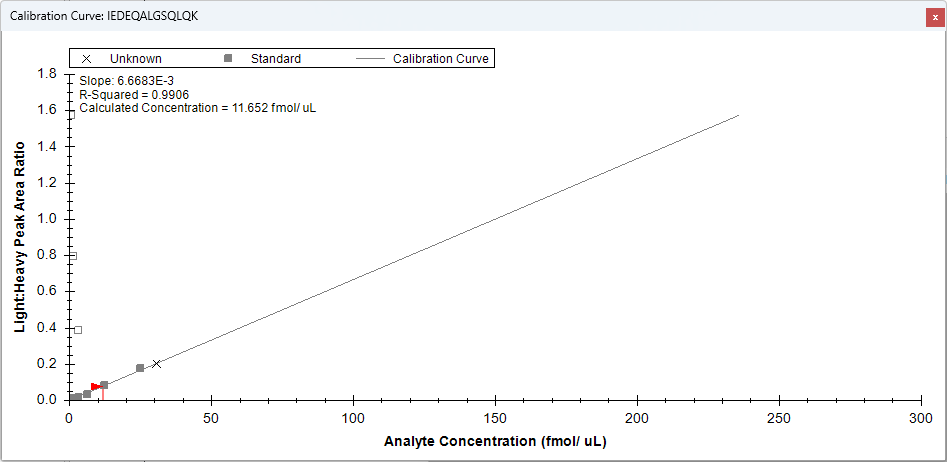
CalibrationCurveWithExcludedPoints.png".

Hope this helps,
-- Nick